A guide from our expert about how to monitor Jira using Prometheus, Grafana.

Any support or DevOps service or team needs a powerful active monitoring, alerting and escalation solution. While providing Jira consulting and supporting services 24/7, we need to make sure that everything is going according to the plan and works perfectly, and if there is any potential issue, we could react immediately before it becomes a problem.
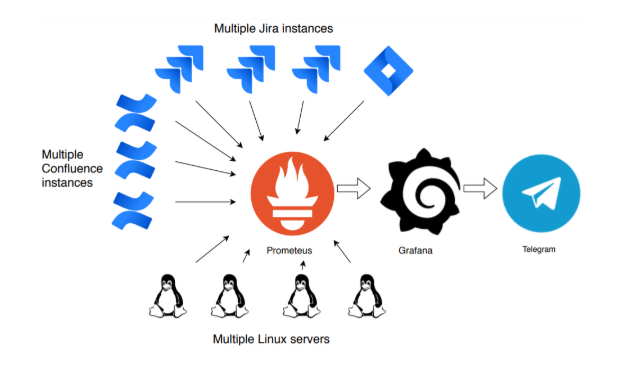
If you google the best solution for a system monitoring, you will find out that there are some leaders of the market and there are many articles of their pros and cons. Still, we prefer the complex solution, consisting of Prometheus, Grafana and Telegram
What do they do?
- Prometheus is used for monitoring and service information (metrics) storing;
- Grafana helps with information visualization;
- Telegram as a messenger for alerting and team communication.
Let’s get more acquainted with Prometheus + Grafana + Telegram monitoring solution.
Prometheus
So, Prometheus is a free (open source) tool which permits its users to monitor the metrics and alerts by collecting and recording real-time metric data from various systems in a TSDB (a time-series database). All metric data is got with the help of HTTP pull model. There are also built-in flexible query composer and the possibility of real-time alerting, but actually, Grafana also has this feature, and it’s much more powerful than the Prometheus one.
There are many components of the Prometheus architecture, but the fundamental items are:
- Main server for time-series data storing;
- Exporters for services (to get metrics);
- Push gateway that supports short-lived jobs;
- Alertmanager for alerting.
How to install the Prometheus server
Good news is that you can just download the installation package right from the official website. But please remember that since Prometheus does not directly support basic authentication, it’s better to use the reverse proxy (Nginx) to configure authentication.
After the installation of the main server, you can turn to the monitoring of the main parameters of the Linux server, as well as Jira and Confluence monitoring via Prometheus.
How to install an exporter
Before that, you need to add a new entity to the system, and to do this you need to install an exporter, like Prometheus exporter, Node_Exporter, PostgreSQL exporter and others.
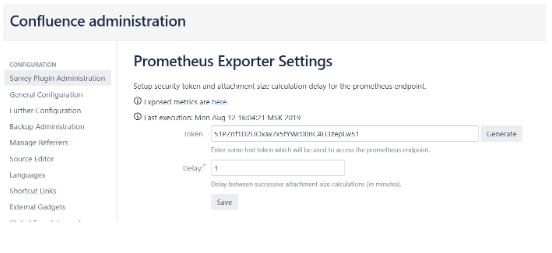
They are addo-ons (apps) for Jira and Confluence, and you can install them via Atlassian marketplace. After the installation, it’s important to use the token to prevent public access to your data. To find it in the exporter, go to “Manage Apps” in Jira or Confluence and choose “Prometheus Exporter Settings:
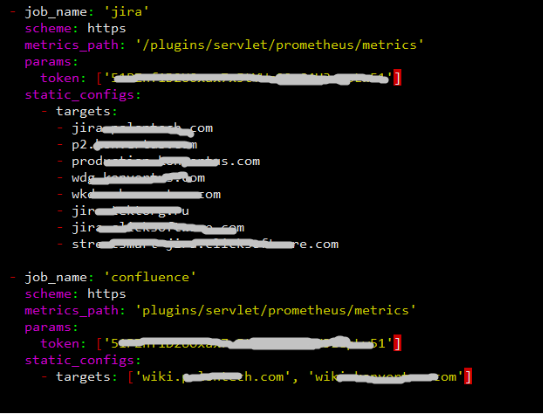
Don’t forget to make sure that after the exporter installation, the link used for metric export is available from the Prometheus server. After that you need to add a source to Prometheus under corresponding job name (prometheus.yml – configuration file):
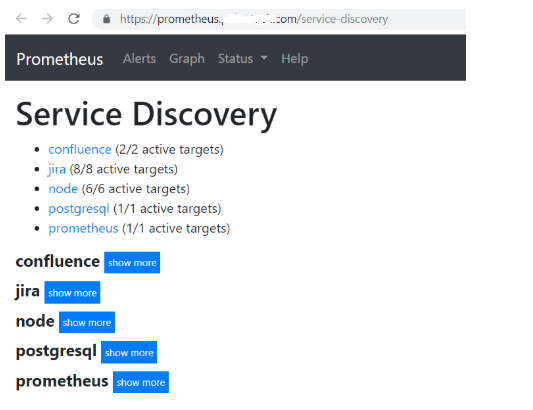
Then restart Prometheus and check your new entity in service discovery:
sudo systemctl restart prometheus
You will found the Prometheus service discovery panel under this URL: https://prometheus,<you-domain-name>.com/service-discovery
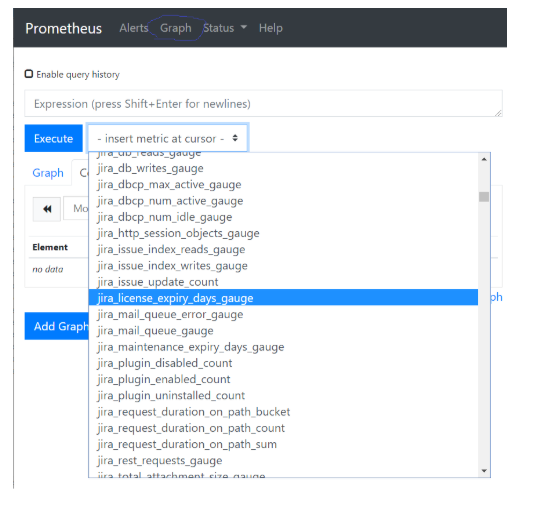
There are plenty of useful metrics that you can directly in Prometheus using the PromQL. With them, you can control the number of projects (to be prepared for a potential infra growth) or use metrics to verify the license expiration of multiple Jira or Confluence servers.
Other exporters installation
Also, we normally install OS exporters to monitor a server metrics (memory, CPU load, disks space, etc.).
Grafana
Grafana is also an open-source tool for metric analysis and visualization of the time series data,. And in regards of visualization it is more powerful than Prometheus.
Grafana Installation and Configuration
The installation process is pretty simple, you can find all the information about it in the official docs: https://grafana.com/docs/installation/rpm/.
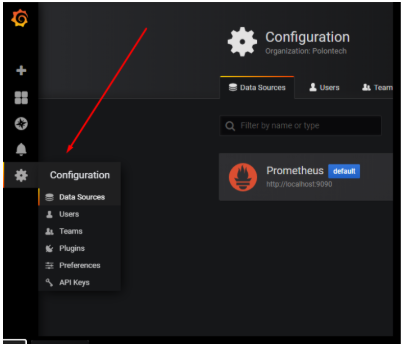
The basic version of Grafana supports many different storage backends for your time series data – it’s a Data Source, which has a specific and customizable Query Editor. For this reason, Grafana is a good fit for Prometheus, and for this, we need to add a new Data Source Prometheus.
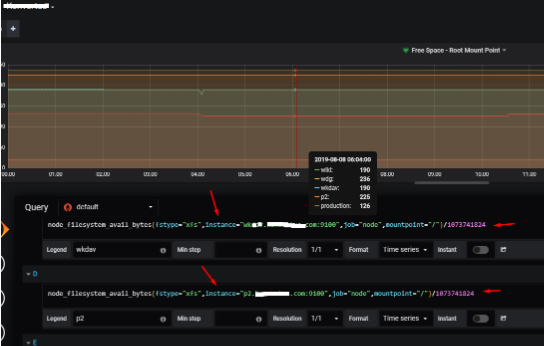
To do the configuration, you just need to add the Prometheus access details. After that, you’ll be able to instantly build your dashboards, graphics, and charts. Or you can simply use any of already built dashboards from this list: https://grafana.com/grafana/dashboards.
To filter the required data it’s also important to check and update queries for panels, using PromQL – Prometheus query language.
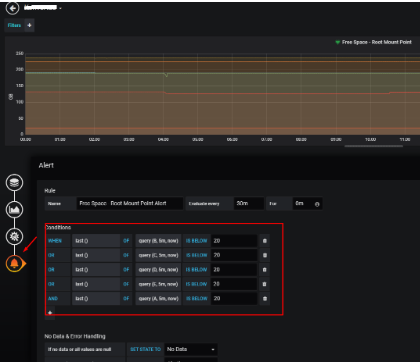
Grafana alert specialties for Jira and Confluence
Grafana allows setting alerts to different events. To install the alerting channel you need to open the Settings menu and click on the “New Channel”.
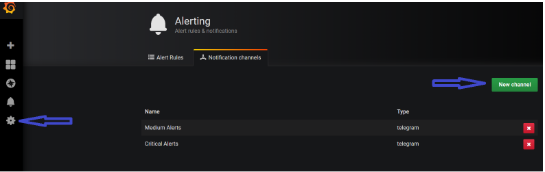
Another good point is that Grafana supports popular messengers like Telegram, MS Teams, Slack and such escalation tools like OpsGenie and PagerDuty.
For example, we choose Telegram, so we have two channels with different reminder settings (12h and 3min) – Medium alerts and Critical alerts. Note that alerts are active only in Query panels.
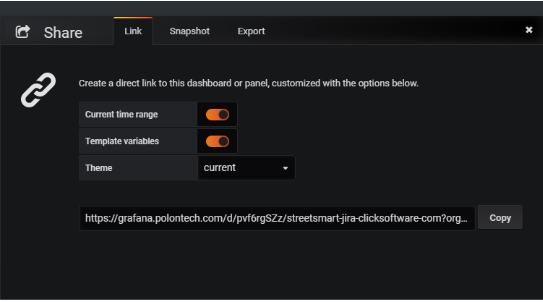
Plus, Grafana is a simple tool for user/team management, as you can build there specific customers dashboards and share them if you need:
So, Prometheus and Grafana are the perfect fit for Jira and Confluence monitoring, and this powerful solution will surely help to prevent any incident. Turn to Polontech, and we’ll do the Jira health check service for you!